Basic Concepts and Theories
What are ETF’s?
Investors who feel they do not have the time to manage a share portfolio or insufficient capital to achieve a large enough spread of stocks or the right stock-picking skills have the option of investing in third-party vehicles such as unit trusts or Exchange Traded Funds (ETFs).
ETFs are publicly listed investment funds that trade on a stock exchange in the same manner as ordinary stocks. ETFs combine the benefits of traditional stock trading, such as intraday pricing and accessibility, with the advantages of fund investments, such as ready-made diversification.
Even though a great variety of ETFs exist, a number of common features can be found in ETFs. Besides being traded on an exchange, ETFs are typically passively managed, meaning there is no dedicated asset manager appointed trying to beat the market. Instead the ETFs typically have an objective of replicating the performance of a specific index or benchmark, like specific stock, bond, commodity and currency indices or baskets.
ETFs have a number of other advantages for investors compared to unit trusts. Firstly, ETFs are listed and trade all day compared to unit trusts that are priced once daily. Secondly, the spread (difference) between the buying and selling prices is smaller for Satrix (one example of an ETF) than for unit trusts.
Why trade ETF’s?
Versatile, low-cost trading with ETF’s.
Some ETFs, called Inverse ETFs or Short ETFs, replicate the inverse performance of the index or benchmark, offering investors the chance to benefit from falling prices. Meanwhile, Leveraged ETFs offer a fixed amount of leverage on the performance of an index, usually around 2:1 or 3:1.
The passive management of ETFs also typically results in a low-cost structure relative to traditional funds. This benefit, combined with the availability of leveraged or inverse tracking of specific indices or benchmarks, makes ETFs ideal for intelligently creating diversified portfolios. The trader can express individual views and preferences and gain efficient exposure to specific sectors, regions or indices.
Another general feature is that the ETF stocks trade very close to the net asset value of the underlying fund assets. This is ensured because so-called 'authorised participants' – typically large institutions – can exchange ETF stocks directly with the fund, with the actual underlying asset used as in-kind payment. Hence, authorised participants will take advantage of any arbitrage possibilities if the price of the ETF share is notably higher or lower than the underlying net asset value. The effect of this is ensuring the ETF share price stays close to the net asset value.
Standard Bank offers access to a wide range of Exchange Traded Funds from various Tier one providers such as iShares, Powerstocks, Rydex, StreetTRACKS, SGAM ETFs, Lyxor ETFs and many more. Clients can invest in ETFs directly from Standard Bank's platforms, while all funds tradable can be bought or sold using the Stock Trading module or the Price List.
Clients can then track the performance of an ETF through the Standard Bank platforms. It is possible to monitor the price of the ETF through the Price List and to use the charting system to identify longer-term price trends and review past performance.
What are ETC’s?
Exchange Traded Commodities (ETCs) are securities that individuals can trade on a regular stock exchange in the same way as a company stock. ETCs are similar to Exchange Traded Funds (ETF) in that they both track an index.
The difference is that an ETF index usually tracks a group of companies or a sector, where an ETC is based on an index of a commodity or a basket of commodities. The way the ETC is linked to the underlying commodities depends on the exposure of ETC. Because ETCs are open-ended, new ETCs can be created according to demand. Therefore ETCs are just as liquid as the underlying commodities market – either the physical or futures market.
Why trade ETC’s?
- Easy access the markets – ETCs are traded as Stocks on an exchange
- Low cost
- High liquidity (Matching the underlying commodities physical or futures markets)
- Daily transparent pricing
Fundamental analysis
Fundamental analysis examines the core underlying elements that influence the economy of a particular entity, like a stock or a currency. It attempts to predict trends and price action by analyzing economic indicators, government policy, societal and other factors within a business cycle framework.If you were to compare the markets to a clock, fundamentals are the gears and springs that move the hands around the face. Anyone can tell you what time it is, but the fundamentalist knows about the inner workings that move the clock's hands towards that time (or prices) now and in the future.
Are you a technician or a fundamentalist?
There is a tendency to box traders into two distinct schools of thought: fundamental or technical. In fact, most smart traders favour a blended approach rather than being a purist of either type. Fundamentalists need to keep an eye on signals derived from price charts, while few technicians can afford to completely ignore impending economic data, critical political decisions or pressing societal issues that influence price action.
Forecasting economic conditions using models
Fundamental analysis is very effective for forecasting economic conditions, but not necessarily as effective in predicting exact market prices. Studying GDP forecasts or employment reports can give you a fairly clear picture of an economy's health and the forces at work behind it, but you still need a method to translate that into specific trade entry and exit points.
The bridge between fundamental data and a specific trading strategy usually comes from a trader model. These models use current and historical empirical data to estimate future prices and translate those into specific trades.
Beware of “analysis paralysis”
Forecasting models are both an art and a science. There are so many different approaches that traders can sometimes feel overloaded. It can be difficult trying to decide when you know enough to pull the trigger on a trade.
Many traders switch to technical analysis at this point to test their theories and see when price patterns suggest that an entry is viable.
Look for fundamental drivers first
The fundamentals include everything that makes a country and its currency tick. From interest rates and central bank policy to natural disasters, the fundamentals are a dynamic mix of distinct plans, erratic behaviours and unforeseen events.
That said, not every development will move a country's currency. It is helpful to start by identifying the most influential contributors to this mix rather than following every fundamental that occurs.
Forex market drivers
- Rising interest rates strengthen that country’s currency
In general, most people think about interest rates in terms of how much it costs to borrow money, on a home loan for example, or how much could be earned on a bond or and money market investments. Interest rate policy is a key driver of currency prices and typically a strategy for new currency traders. Fundamentally, if a country raises its interest rates, its currency prices will strengthen because the higher interest rates attract more foreign investors.
For example, higher rates in the Euro zone may prompt US investors to sell US Dollars and buy bonds in Euros. Similarly, if interest rates increase in Switzerland, those investors may decide to sell their Euro-bonds and move into bonds in Swiss Francs, driving Euros down and Swiss Francs up.
- When gold goes up, the USD goes down (and vice versa)
Historically, gold is a "safe haven", a country-neutral investment and an alternative to the world's other reserve currency, the US Dollar. That means gold prices have an inverse relationship to the USD, offering several ways for currency traders to take advantage of that relationship.
For example, if gold breaks an important price level, you would expect gold to move higher. With this in mind, you might sell dollars and buy Euros, for example, as a proxy for higher gold prices.
- Rising gold prices help major gold producers
Canada is the third largest producer of gold worldwide, while Australia is the world's third largest exporter. These two major currencies tend to strengthen as gold prices rise. You might consider going long on these currencies when gold is increasing in value, or trade your GBP or JPY for these currencies when gold is on the rise.
- Oil dependant countries’ currencies weaken as the oil price rise
Just as airlines and other oil-dependent industries suffer when oil prices rise, so do the currencies of oil-dependent countries like the US or Japan, both of which are largely dependent on foreign oil.
When trading, if you believe oil prices will continue to rise, you could consider buying commodity-based economies like Australia or Canada or selling oil-dependent currencies.
Economic indicators
- What are economic indicators?
Economic indicators are snippets of financial and economic data published regularly by governmental agencies and organizations within the private sector. These statistics help market observers monitor the economy's pulse, which is why they are loyally followed by almost everyone in the financial markets.
Since so many people are poised to react to the same information, economic indicators have tremendous potential to generate volume and to move prices. Although it might seem at times like you need an advanced economics degree to analyse this data accurately – in reality traders only need to keep a few simple guidelines in mind when making trading decisions.
- Mark your economic calendars
It is helpful to diarise the exact date that each economic indicator will be released. Keeping an eye on the economic calendar not only helps you consider trades around these events, it helps explain otherwise unanticipated price actions during those periods.
Consider this illustration: on a Monday, with the USD having been in a tailspin for three weeks, many traders have short USD positions. That Friday, however, US employment data is scheduled to be released and the report looks promising. As a result, traders may start unwinding their short positions before Friday, leading to a short-term rally in USD through the week.
- What does this data mean for the economy?
It is not necessary to understand every nuance of each data release, but it may be worthwhile to try to grasp key, large-scale relationships between reports and what they measure in the economy: for instance, knowing which indicators measure the economy's growth (gross domestic product, or GDP) versus those that measure inflation (PPI, CPI) or employment strength (non-farm payrolls).
- Not all economic indicators move the market
The market is known to pay more attention to certain indicators under certain conditions - and that focus can change over time. For example, if prices (inflation) are not a crucial issue for a given country, but its economic growth is problematic, traders may pay less attention to inflation data and rather tend to focus on employment data or GDP reports.
- Look out for the unexpected
Frequently the data itself may not be as important as whether or not it meets market expectations. If a given report differs widely and unexpectedly from what economists and market pundits were anticipating, market volatility and potential trading opportunities are usually the result.
At the same time, it is prudent to be cautious of acting too quickly when an indicator falls outside expectations. Each new release of an economic indicator contains revisions to previously released data.
- Try not to get bogged down in the details
While it may be important for an economics professor to appreciate all the nuances of an economic report, traders should filter data judiciously for their own purposes: thereby making intelligent trading decisions.
For example, many new traders watch the headlines of new employment reports, for example, assuming that new jobs are vital for economic growth. That may be true generally, but in trading terms non-farm payrolls is the figure traders watch most closely and therefore has the biggest impact on markets.
- There are two sides to every trade
Hopefully our discussion has helped you realize the importance of watching economic indicators - and knowing which data is most likely to move markets and impact currency traders.
No trader's knowledge can be complete all the time. Although you may closely follow and understand the impact of economic data published in the US - there may be times when data published in Europe or Australia will have a surprising impact on your currency market. Doing your homework before trading any currency will help you guard against unnecessary risks.
- Economic indicators: a currency's vital signs
Traders can measure the economic health of a given country (and its currency) through its economic indicators – but bear in mind that not all statistics count equally. A few of the key economic indicators that often impact currency traders are covered below.
Economic indicators can be divided into leading and lagging indicators:
- Leading indicators are economic factors that change BEFORE the economy starts to follow a particular trend. They are used to predict changes in the economy.
- Lagging indicators are economic factors that change AFTER the economy has already begun to follow a particular trend. They are used to confirm changes in the economy.
- Major economic indicators
Gross Domestic Product (GDP)
GDP is the sum of all goods and services produced either by domestic or foreign companies. GDP indicates the pace at which a country's economy is growing (or declining) and is considered the broadest indicator of economic output and growth.
Industrial Production
A measure of the change in the production of the nation's factories, mines and utilities, industrial production also measures the country's industrial capacity and the extent to which it is being used (otherwise known as capacity utilisation).
The manufacturing sector accounts for a quarter of the major currencies' economies, so it is critical to watch the health of factories and whether their capacity is being maximised.
Purchasing Managers Index (PMI)
The National Association of Purchasing Managers (NAPM), now called the Institute for Supply Management, releases a monthly composite index of national manufacturing conditions. The index includes data on new orders, production, supplier delivery times, backlogs, inventories, prices, employment, export and import orders. It is divided into manufacturing and non-manufacturing sub-indices.
Producer Price Index (PPI)
This indicator measures average changes in selling prices received by domestic producers in the manufacturing, mining, agriculture, and electric utility industries.
The PPIs most often used for economic analysis are those for finished goods, intermediate goods, and crude goods.
Consumer Price Index (CPI)
CPI measures the average price level paid by urban consumers (making up 80% of the population in major currency countries) for a fixed basket of goods and services. It reports price changes in over 200 categories.
The CPI also includes various user fees and taxes directly associated with the prices of specific goods and services.
Durable Goods
Durable Goods Orders measures new orders placed with domestic manufacturers for immediate and future delivery of factory hard goods. A durable good is a product that lasts longer than three years, during which its services are extended.
Companies and consumers sometimes put off purchases of durable goods during tough economic times, and can therefore be a useful measure of certain kinds of customer demand.
Retail Sales
Retail Sales measures total receipts of retail stores from samples representing all sizes and kinds of business in retail trade throughout the nation. It is the timeliest indicator of broad consumer spending patterns and is adjusted for normal seasonal variation, holidays, and trading-day differences.
Retail sales include durable and nondurable merchandise sold, and services and excise taxes incidental to the sale of merchandise. It does not include sales taxes collected directly from the customer.
Housing Starts
This indicator measures the number of residential units that begin construction each month. A "start" refers to excavation of the foundation of a residential home.
Housing is usually one of the first sectors to react to interest rate changes. Significant reaction of start/permits to changing interest rates signals interest rates are nearing their trough or peak. You can analyse the data by focusing on the percentage change in levels from the previous month. The report is released towards the middle of the following month.
Technical analysis: trends, support and resistance
What is technical analysis?
Technical analysis attempts to forecast future price movements by examining past market data. Most traders use technical analysis to get a "big picture" on an investment's price history. Even fundamental traders will glance at a chart to see if they are buying at a fair price, selling at a cyclical top or entering a choppy, sideways market.
Technical analysts make a few key assumptions
All market fundamentals are reflected in price data. Moods, differing opinions, and other market fundamentals need not be studied.
Market history repeats itself in regular, fairly predictable patterns. These patterns, generated by price movements, are called signals. A technical analyst's goal is to uncover a current market's signals by examining past market signals.
In a similar vein, prices also tend to move in trends. Technical analysts believe price fluctuations are not random and unpredictable. Once an up, down or sideways trend has been established, it usually will continue for a period.
Get in and get out at the right time
Traders rely on price charts, volume charts and other mathematical representations of market data (called studies) to find the ideal entry and exit points for a trade. Some studies help identify a trend, while others help determine the strength and sustainability of that trend over time.
Technical analysis can add discipline to and minimise the emotion in your trading plan. It can be hard to screen out fundamental impressions and persist with your entry and exit points as planned. While no system is perfect, technical analysis helps you see your trading plan through more objective and dispassionate eyes.
Price chart types
-
Bar charts
Bar charts are used most frequently to display price action. Each bar represents a period of time – where a "period" could be as short as one minute or as long as several years. Over time, bar charts show distinct price patterns. -
Candlestick charts
Instead of a simple bar, each candlestick shows the high, low, opening and closing price for the period of time that it represents. Candlestick patterns provide greater visual detail as they develop.
Technical indicator types
-
Trend
Trend indicators smooth out price data, allowing you to easily see a persistent up, down or sideways trend. (Examples: moving averages, trend lines.) -
Strength
Strength indicators describe the intensity of market opinion on a certain price by examining the market positions taken by various market participants. Volume or open interest are the basic ingredients of strength indicators. -
Volatility
Volatility refers to the magnitude of day-to-day price fluctuations, whatever their directional trend. Changes in volatility tend to anticipate changes in prices. (Example: Bollinger Bands.) -
Cycle
Cycle indicators indicate repeating market patterns from recurrent events such as seasons or elections. Cycle indicators determine the timing of a particular market pattern. (Example: Elliott Wave.) -
Support/resistance
Support and resistance describes the price levels where markets repeatedly rise or fall and then reverse. This phenomenon is attributed to basic supply and demand. (Example: Trend Lines.) -
Momentum
Momentum indicators determine the strength or weakness of a trend as it progresses over time. Momentum is highest when a trend starts and lowest when the trend changes.
When price and momentum diverge, it suggests weakness. If price extremes occur with weak momentum, it signals the end of a movement in that direction. If momentum is trending strongly and prices are flat, it signals a potential change in price direction (for example, Stochastic, MACD, and RSI).
Technical indicators
- Using technical indicators
The difference between price charts and technical indicators are that charts assist in identifying trade worthy market trends - while indicators help traders to judge a trend's strength and sustainability.
It is best to confirm the shift if an indicator suggests a reversal, before you act. That might mean waiting for another period to confirm the same indicator's signal, or consulting another indicator. Patience goes a long way in preparing you to you read signals accurately and respond accordingly.
- Types of moving averages
As one of the most widely used indicators, moving averages helps traders to verify existing trends, identify emerging trends, and view overextended trends on the verge of reversing. As the name would suggest, a chart consists of lines overlaid on one another which "average out" short-term price fluctuations, in order to distinguish the long-term price trend.
A simple moving average equally weights each price point over a specified period. The trader defines whether the high, low, or close is used, and these price points are added together and averaged, forming a line.
A weighted moving average gives more emphasis to the latest data. It smoothes out a price curve, and at the same time makes the average more responsive to newer price changes.
An exponential moving average weights more recent price data in a different way, by multiplying a percentage of the most recent price by the previous period's average price.
- Finding the best moving average period for your pair
It can take a while to find the best combination of moving average and period length for your currency pair. The right arrangement will make the trend you would like clearly visible as it develops. Finding an optimal fit is called curve fitting.
Usually traders start this process by comparing a few timeframes for their moving averages using a historical chart. They are then able to compare how well and how early each timeframe signaled changes in the price data as they developed, and make the necessary adjustments.
When you have found a moving average that works well for your currency pair, you can consider this as a line of support for long positions or resistance for short positions. If prices cross this line, it often signals a currency is reversing course.
Consider this example in support of this point:
Longer-term moving averages (MAs) define a trend, but shorter-term MAs can signal its shift faster. That is why many traders watch moving averages within different timeframes at once. If a short-term MA crosses your longer term MA, it can signal that a trend is ending and that it may be time to pare back your position.
- Stochastic
Stochastic studies, or oscillators, help monitor a trend's sustainability and signal reversals in prices. Stochastic come in two types, %K and %D, measured on a scale from 0 to 100. %K is the "fast", more sensitive indicator, while %D is "slow" and takes more time to turn.
Stochastic studies do not work well in choppy, sideways markets. In these conditions %K and %D lines might cross too frequently to signal anything significant.
- Relative strength index
Like the stochastic, the relative strength index (RSI) measures momentum of price movements on a scale of 0 to 100.
It is noteworthy to mention that RSI signals should always be confirmed with other indicators. RSI can remain at lofty or sunken levels for a long time, without prices reversing course. This simply signifies that a market is either relatively strong or weak - and is likely to remain that way for a while.
Adjust your RSI to the right timeframe for you. A short-term RSI will be very sensitive and offer many signals, not all of them sustainable; a longer term RSI will be less irregular. Try to match your RSI timeframe to your own trading style: short-term works well for day traders, while longer term may suit position traders better.
Divergences between prices and RSI may suggest a trend reversal. Remember to confirm any signals before acting.
- Bollinger bands
Bollinger Bands are volatility curves used to identify extreme highs or lows in price. Bollinger Bands establish "bands" around a currency's moving average, using a set number of standard deviations around the moving average. Its creator Jon Bollinger recommends the following:
Touching a high or low band does not necessarily suggest an immediate trend reversal. Bollinger Bands adjust dynamically as the volatility changes, and touching the band could simply denote that prices are extremely volatile. Use Bollinger Bands with other indicators to determine the strength of a trend.
- MACD
Developed by Gerald Appel, MACD (pronounced "Mac-Dee") plots the difference between 26-day and 12-day exponential MAs.
A 9-day MA serves as a trigger line: when MACD crosses below the trigger line, the signal is bearish; when MACD crosses above the trigger line, the signal is bullish.
If MACD becomes positive and makes higher lows while prices are still falling, this could indicate a strong buy signal. Conversely, if MACD makes lower highs while prices are reaching new highs, this could be a strong bearish divergence and a sell signal.
- Fibonacci Retracements
Fibonacci retracement levels are a sequence of numbers discovered by the noted mathematician Leonardo da Pisa in the 12th century. These numbers describe cycles found throughout nature; technical analysts use them to find pullbacks in the currency market.
After a significant price movement, either up or down, prices often "retrace" most or the entire original move. As prices retrace, support and resistance levels often occur at or near the Fibonacci Retracement levels. In terms of currencies, retracements usually happen at 23.6%, 38.2%, 50% or 61.8% of the previous move.
Using indicators
- Using indicators to identify trends
You may have heard the expression "the trend is your friend". But what does it mean? If your trend takes a sudden counter-move and your trailing stop activates at a loss, it is natural to wonder how it could be possible to select a more useful trend the next time.
- Confirm the trend is real
Using technical indicators in combination is a good habit to foster for many kinds of technical trading, but especially in forex. It can help to ensure the resilience of potential trend. Currencies tend to move in trends naturally due to long-term macroeconomic factors and short-term international capital flows. This makes it even more difficult to identify a trade-able trend that will last.
- Trend lines
From a trader's perspective, a trend is a predictable price response at levels of support or resistance that change over time. Trend lines mark these levels, with support acting as the "floor" and resistance as the "ceiling". When prices break through either of these levels, it signals a trend that the movement is set to continue.
Hindsight makes it easy to draw perfect trend lines on historical charts. However, it is much tougher to be right when the trend is still developing. Nevertheless trend lines help to focus your attention on finding support and resistance levels, which is the first step towards identifying a new trend.
Start by drawing trend lines over longer timeframes (daily or weekly charts) and then carry them forward into shorter timeframes (hourly or 4-hourly). This exercise helps to highlight the most important support and resistance levels first so that you do not lose sight of a major trend developing by chasing a short-term, minor one.
- Directional Movement Index (DMI)
Developed by J. Welles Wilder, the DMI minimises the guesswork in spotting trends and helps confirm trend line analysis.
The DMI system has two parts:
-
- ADX (average directional movement index)
If the ADX reading is above 20, it indicates a "real" or sustainable trend. The ADX also measures the trend's strength: the >higher the ADX, the stronger the trend.
The ADX also provides an early indicator of a trend's end. When it drops from its highest level, it may be time to exit the position and wait for a fresh signal from the DI+/DI-.
-
- DI+ and DI- lines
When DI+ crosses up through DI-, it is considered a buy sign; when the opposite happens, it usually signifies a sell sign.
Wilder recommends following the "extreme point rule" to confirm the signals. Note the extreme point for that period in the direction of the crossover (the high if DI+ crosses up over DI-; the low if DI- crosses up over DI+). Only if that extreme point is breached in the subsequent period is a trade signal confirmed.
Many traders use the parabolic indicator along with the ADX to identify a trend's end. The parabolic indicator follows the price action but accelerates its own rate of increase over time and in response to the trend. The parabolic continually closes in on the price, and only a steadily accelerating price rise (the essence of a trend) will prevent the price from falling below the parabolic, signaling an end to the trend.
- Trading short-term
The methods above can be used for short-term decision making, even in markets that are considered "trendless" – in other words, "those that trade sideways".
However, if you are trading short-term, it would be unwise to entirely ignore the big picture. There is no point in trying to ride a short-term trend that is moving against the larger trend.
Charts
Knowing how to read chart patterns for buy and sell signals is critical. Reading chart patterns gives you the ability to identify new trends through technical analysis, which improves your chances of trading success. However you choose to trade, our tools will help you to decode chart patterns and to act on the information you read from them.
Webtrader's charting package suits all trading styles and experience levels. It is a robust yet easy to use charting tool that is fully integrated into your Trading Platform. Existing live and practice account clients can use Webtrader charts at no extra cost.
Features of charting tools
Our currency charts are fully integrated on the platform. They combine a rich, intuitive interface and a variety of the tools and resources you require to enhance your forex trading.
With numerous technical and line studies incorporated into the package, there are plenty to choose from, whatever your preference may be: Stochastics, Bollinger Bands, Moving Averages, Ichimoku or Fibonacci.
Stop loss orders
A stop-loss order is an order you place that potentially exits your trade if the currency pair reaches a specified price point. Stop-loss orders allow you to potentially protect your trading account even when you are not in front of your computer—which is essential since it is physically impossible for you to watch your trades twenty four hours a day.
If you buy a currency pair, you will place a stop-loss order somewhere below the current price to protect you in the event the currency pair turns around and starts moving lower. If you sell a currency pair, you will place a stop-loss order somewhere above the current price to protect you in the event the currency pair turns around and starts moving higher.
Here is how it works. Imagine you buy the EUR/USD at 1.4000. You notice that there is strong support, approximately 50 pips below this price level at 1.3950, and you conclude that if the EUR/USD breaks below this level it will most likely continue to move lower. Since you bought the currency pair, and you will be losing money if it moves lower, you decide you do not want to hold onto the trade if the EUR/USD breaks below 1.3950. To protect your account, you set a stop-loss order at 1.3940 that exits the trade if the EUR/USD touches the 1.3940 price level. Whether it is in the middle of the night or it is the middle of the day, if the price of the EUR/USD drops to 1.3940, the trade will automatically be exited for you.
Spot Precious Metals
Much like trading currency pairs, spot metals enable traders to take a long or short position for example, in gold (XAU/USD) or silver (XAG/USD) while simultaneously taking the opposite position in the US Dollar or other major currencies. Spot Precious metals trading is an over-the-counter market globally. Prices float freely based on supply and demand. The spot price is the price quoted for the metal to be paid - including delivery - two days following the date of the actual transaction (also known as the settlement date).
Spot Precious Metals trade in a similar manner to how currency pairs are traded in the foreign exchange market. Trading is available 24 hours a day from Sunday at 24h00 to Friday at 23h00 (CAT). During the US Winter, trading will be from Monday 01h00 to Friday 24h00 (CAT). Although there is no central market, the main centers for trading Spot Precious Metals are London, New York and Zurich.
Liquidity is typically highest when European market hours overlap with trading in New York - roughly four hours a day during the morning for US traders. There may be some illiquid periods for trading spot Precious Metals around the close of the US market (17h00 to 18h00 ET). The twice-daily gold fix and daily silver fix in London helps set reference points for intraday prices. Settlement happens in much the same way as it would for foreign exchange settlements.
Who trades Spot Precious Metals?
There are many different reasons that drive investors to trade Spot Precious Metals. Some of these are:
- Speculation on the price based on the use of fundamental and or technical analysis.
- Creating a balanced, diversified asset allocation model for an overall investment portfolio.
- Applying risk management as a hedge against market volatility and financial crises caused by economic, political or social turmoil.
How to read a Spot Precious Metals quote
Reading a Spot Precious Metals quote is very similar to reading a FX Spot quote. It is even represented the same way (for example, spot gold traded against the US Dollar is XAU/USD).
Consider the following example:
XAU/USD 1700.00
- The first symbol listed is one (1) troy ounce of gold.
- The value of gold is always one (1).
- The price literally translates to: one (1) ounce of gold is equal to 1700.00 US Dollars.
When the price or quote for gold goes up, it denotes that gold has strengthened in value and is therefore worth more dollars than before. If the price of gold declines, it takes fewer dollars to purchase one (1) ounce of gold and one could therefore conclude that the value of the dollar had increased compared to the value of gold.
Bids, asks and spreads
Identically to other markets, Spot Precious Metal quotes consist of two sides, the bid and the ask price:
- The BID is the price at which you can SELL.
- The ASK is the price at which you can BUY.
The difference between the bid price and ask price is called the spread.
Calculating Profit and Loss ( P&L)
Consider the following examples:
Profit and loss calculations for Spot Precious Metals are fairly simple. The smallest increment of a spot gold price is 0.01. For spot silver, it is .001. The smallest trade you can place in spot gold or silver is a single lot. For gold that is 10 troy ounces, and for silver it is 500 troy ounces. At this level, each pip is worth US$0.10 for gold and US$5 for silver. For example, a change in price from 1720.50 to 1720.80 in gold means a difference of 0.30, or 30 pips. If you are trading one (1) lot, and each pip is worth 10 cents, then the profit or loss from this trade would be US$3.00. If you decide to trade more than one lot, the value of each pip is simply multiplied by the number of lots you are trading.
Pips or points: what is the difference?
Like forex prices, spot gold prices are quoted in tiny increments called pips ("percentage in points"). Located at the second decimal place for a spot gold quote, or 0.01, each pip represents one (1) cent in dollar value.
Market drivers
The following factors and conditions may influence the price of metals:
- As a hedge against inflation
Investing in gold and silver is often seen as a hedge against inflation. The thinking behind this is that when buying power decreases, thereby affecting the price of currencies, owning gold will hedge against your wealth decreasing. Doing so ensures that you will receive a commensurate amount of currency for the amount of gold you own, no matter what the inflation rate is.
- As an alternative to the US Dollar
Gold and silver is also used as a hedge against the US Dollar in times of economic turbulence. Thus when the reserve currency comes under pressure, investors tend to seek out alternatives.
- A “safe-haven” investment
Another view of gold is as a "safe-haven" investment. During times of high volatility and risk, investors may move funds to gold as a way to safeguard against uncertainty.
- Understanding economic and political factors
Indicators that impact inflation such as the consumer and producer price indices, interest rate announcements, and treasury auctions play a large part in determining the inflation rate, and therefore have an impact on gold prices. Macroeconomic indicators, such as the Unemployment Rate and Gross Domestic Product (GDP) also shed light on the strength of an economy, and may lead investors to lean towards or away from spending money on gold.
In the past, there has been a strong negative correlation between precious metals and the US Dollar. In the current economic environment this correlation has weakened, however we should keep in mind that it could resurface at any time.
Political events can also significantly impact the price of gold. If uncertainty arises over conflict in the Middle East, this might have an effect on the perceived safety of an investment in a country's bonds or currency, and to hedge against this risk, investors might move funds into gold or cash. Oil and other commodity prices may also be affected, which could carry over into the gold markets, pulling or pushing the price of gold in the same direction as oil.
Typically the spot gold market is somewhat volatile, given the ability to enter and exit trades several times a minute. For this reason, prices may be more susceptible to short-term fluctuations that do not necessarily follow a long-term trend.
Leverage and margin
- Leverage in Spot Precious Metals
Leverage for Spot Precious Metals trading varies according to the type of metal you are trading in – refer to our list of prices for full detail. If the leverage for gold is for example 100:1, for every USD 1 you have in your account balance, you have USD 100 worth of buying and selling power to trade gold. As a result, leverage increases a client's buying and selling power and enables them to participate in a market that may otherwise be cost prohibitive. Do keep in mind though that increasing leverage leads to increased risk.
- Margin in Spot Precious Metals
Margin is the amount of money you must have in your account to hold a particular trade. At 100:1 leverage, your margin factor is 0.01 (1%). This means that you are required to have a minimum cash balance of 1% of the total value of the positions you hold in your account at any one time. If you fall below this amount, your trade may be closed automatically, also referred to as being liquidated.
Take a look at an example:
If you wanted to place a trade of one (1) lot (10 troy oz) of spot gold, and buy it at US$1720.55, the amount of margin you would be required to maintain would be 1% of your trade size.
Therefore, 10 (oz) multiplied by the price (US$1,720.55) and the margin factor (0.01) would give you
US$172.055.
10 x US$1720.55 = US$17,205.50
US$17,205.50 x .01 = US$172.055
This would be the margin requirement for a single lot of spot gold bought at the above price. If your account balance were to fall below this level, your trade would be automatically closed. Another way to look at this example is to say that 100:1 leverage gives you the ability to trade 10 ounces of gold at US$17205.50, with US$172.055
In a nutshell
Spot Gold and Silver prices are quoted internationally in US Dollars per troy ounce. In the following example, a quote of XAU/USD 1700.25 means that 1 oz gold is equal to US$1700.25. If you buy a single lot of gold (one (1) lot = 10 oz) at this price and sell it at a higher price, your profit would be the difference between these two prices. Bearing this in mind, trading Spot Precious Metals on Webtrader is similar to trading currencies.
A typical quote you might receive for spot gold is 1700.25/75. In this scenario, you could sell one (1) or more lot(s) of gold at 1700.25, or buy at 1700.75. The spread you would pay in this example would be the difference between these two prices (900.75-900.25) or 0.50. The dollar amount represented by the change in price would depend upon the size of the trade you have placed.
Shares and market risks
Companies have two choices when they want to raise money to grow their business: to borrow from a bank or issue stocks.
A share represents a proprietary interest that a person holds in a company and shareholders fully participate in the dividends, capital and surplus upon the winding-up of the company The key advantage in issuing shares (or equity) is that the company does not need to pay back the capital amount or make interest payments. Instead, shareholders – the people who buy those shares – can hope to receive dividends and see a capital gain on their investment.
Share trading involve risk. Traders accept these risks every day as they risk a portion of their capital in the hope of receiving a return on their investment. You win some and you lose some. However, the better you understand the risks that affect you as a trader the better you can protect yourself from those risks.
Traders have to confront many forms of risk as they evaluate and manage their trades. For instance a trader who owns stocks in Wal-Mart (WMT:xnys) has to be concerned not only with how well Wal-Mart as a company is performing but also with the general condition of economies around the world. They also have to be concerned with how well the U.S. stock market is performing and whether or not the value of the U.S. dollar is strong or weak, rising or falling.
As you will have to understand all manner of risks if you are to counteract the forces that are going to push your share prices higher and lower. Once you understand the risks facing your trades it is possible to minimize the affect they can have on your profitability.
How a stock exchange works
The New York Stock Exchange (NYSE), the London Stock Exchange (LSE), Tokyo Stock Exchange and the JSE Limited (JSE) are all, simply, markets for stocks.
Stock exchanges have two purposes. Firstly, they are places where traders can buy or sell stocks and, secondly, companies can use them to raise cash to expand their business by selling new stocks to investors.
Stock exchanges provide investors with two advantages:
- They reduce the risk of investing by providing a transparent pricing mechanism for trades.
- They police listed companies. Stock exchanges operate in a strict regulatory environment and companies have to comply with stringent listing requirements.
Investors use share indices to track the performance of the underlying stocks and sectors. When we refer to "the market", we're actually referring to an index that is a proxy for all the stocks listed on that exchange.
An index is defined as "a statistical measure of the changes in a portfolio of stocks representing a portion of the overall market". That means that when an index is up, most share prices have increased and vice versa.
What makes share prices move
In a nutshell, the forces of supply and demand are the key determinants of changes in share prices. In the simplest terms, the share price will go up if more people want to own a share than are prepared to sell it. Over time, a share price will track the underlying trend in the company's earnings: if earnings (and dividends) grow consistently, the share price should follow.
But there are other aspects that affect investor appetite for stocks including the performance of international markets, general economic growth, sector or company-specific news, share buybacks and futures trading.
Overall, share prices tend to go up when the economic news is good as this means companies should see their earnings increase. In addition, good news from a certain sector or company can drive share prices up as investors expect good future earnings.
There are other buyers of stocks apart from investors, including companies (through share buybacks) and futures traders. They also affect the demand/supply equation.
The risks of investing in shares
We've all heard that there's no such thing as a free lunch – and this is as true of investing as anything else. Over time, stocks have outperformed other asset classes – like government bonds, property and bank deposits – but this comes at a cost. That cost is that investing in stocks is riskier than other asset classes. The old adage "high risk, high return" means that an investor who takes on the higher risk of investing in stocks expects a higher return for doing so.
These are some of the risks of investing in stocks:
- Share prices can – and do – go down as well as up. Investors can reduce their risk by doing their homework and always knowing exactly what they're investing in. That includes evaluating "tips from friends".
- Some stocks can be illiquid. This means that they can be difficult to trade, often because there is a controlling shareholder who owns a large percentage of the company and is not selling those stocks on the market. This means that a share can be difficult to sell. To avoid this, invest in more liquid stocks.
- Companies do not have to pay dividends. This is not necessarily a bad sign if the company is keeping that money to invest in its future growth, but is a risk for shareholders who bought that share for the dividend income.
- If a company goes bankrupt, shareholders may lose the entire value of their investment. Ordinary shareholders only receive what's left over once creditors and preference shareholders have been paid their due.
- Companies can disappoint the market by reporting lower-than expected earnings. This can mean the share price either falls or lags behind the growth of its peers.
- Share prices factor in the market's view of management's competence and integrity. Scandals, such as the revelation of fraud or poor corporate governance, can hurt the share price.
But you shouldn't be frightened of investing in stocks. Most listed companies are well-run businesses and their share prices should increase over time.
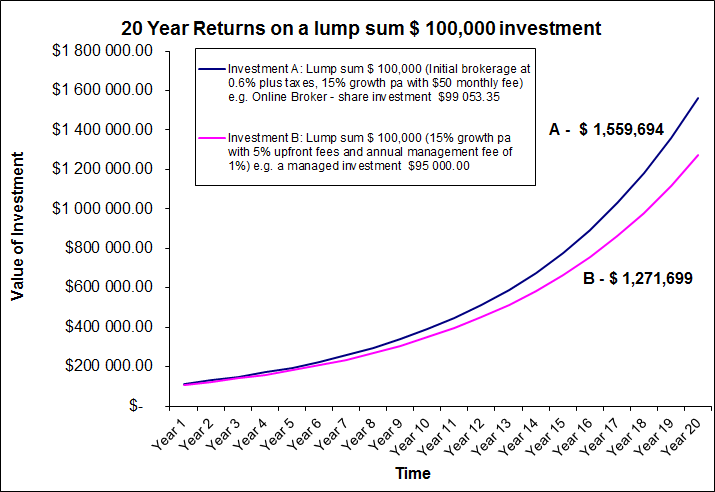
The importance of cutting costs
Ultimately the value of your investments would be determined not only by the return those stocks generate in future, but also by how little it cost you to invest in the first place.
As the graph on the next page shows, you would be better off investing directly in stocks rather than letting someone else manage your money. In this example you can clearly see how much of the value of your long-term investment you "donate" to third parties through upfront and annual fees over 20 years (Investment A vs Investment B). If you believe that you don't have the skills to manage your own portfolio of individual stocks, consider buying an Exchange Traded Fund (ETF). These let you buy a basket of shares at relatively low cost.
The importance of dividends
Investors buy stocks for capital growth, income, or both. Shares usually generate income through the payment of dividends. Simply, dividends are the distribution of a portion of a company's earnings to its shareholders.
However, the size of this dividend is not known to investors as it depends on company profits and is at the discretion of the company's directors. This is unlike a money market deposit, where investors know what they will earn upfront.
Dividends are decided upon and declared by the company's board either annually or half-yearly. But directors can choose to use cash that could be paid out to shareholders for other purposes, including reinvesting it in the company's operations, buying back stocks or paying off debt.
Investors who require income from their share investments should choose stocks with a high dividend yield – the dividend payment as a percentage of the company's share price. Like an interest rate, the dividend yield tells you the income return you will receive from that investment.
For investors, the key advantage of receiving dividend income is that it is tax-free in the hands of the recipient.
Tax implications
a) Tax on dividends received
Although South African residents are liable for dividend withholding tax (DWT) at a rate of 15%in respect of South African companies listed on the JSE Limited, the tax rate in other jurisdictions will vary. For example if you earn dividends on any stocks held in the USA, 30% will generally be withheld from that income. South Africa has double taxation agreements in place with certain countries which could reduce the amount of withholding taxes payable. In certain circumstances you are however able to reclaim some taxes that you paid on these dividends. Note that Standard Bank currently does not offer this type of tax reclaim service in-house but we can refer you to an internationally recognized tax reclaim service that can assist you. Contact us for further details in this regard or sign up for the tax reclaim service by selecting the relevant button within the trading platform.
b) Tax on profit made during trading
Profits on investments will be taxed – and investors need to be aware of the different ways in which this may happen.
Novice investors should be aware that the capital gains on share investments can, potentially, be taxed as income if the South African Revenue Service believes the investor is trading in shares for purposes of making a profit (i.e. a profit-making scheme) instead of for purposes of holding them as income-producing investment. The difference between the two is very small and the intention, among other things, of the investor when buying and selling these shares, plays a large part in determining how they will be taxed.
Most investors – particularly those who have committed themselves to long-term wealth accumulation – are likely to not find themselves in this position. Instead, they will be liable for Capital Gains Tax (CGT). CGT is a lower tax rate than income tax – so it's advantageous to investors. In South Africa, individual share investors pay marginal (income) tax on 33.3% of all capital gains. (If you are at the top marginal tax rate of 40%, that equals an effective 13.3% CGT tax rate.)
We advise you to consult your tax adviser before making any investment decisions.
Looking at the numbers
Understanding some rudimentary accounting isn't just for accountants – all investors should have some basic accounting knowledge that will help them in the share-picking process. The good news is that it is easier than you think.
There are three main financial statements that investors should read in the annual report:
- The balance sheet gives a "snapshot" of a company's financial position on a particular day. That snapshot shows the company's assets, liabilities and its net asset value (assets minus liabilities).
- The income statement's purpose is to show a company's profit (or earnings or net income or bottom line). Profit is the amount of money that's left over once all expenses (including operating costs, interest payments and tax) have been subtracted from sales.
- The cash flow statement shows all receipts and payments of cash and the company's cash position at year-end.
Investors can also find important extra information in the statement of changes in equity and the value-added statement. Don't forget to read the notes to the financial statements – they contain the detail you need to evaluate the balance sheet, income statement and cash flow statement.
Investment ratios
For novice investors it can seem strange that a R100 share can be cheaper than a R10 share. The reason is that investors use a number of ratios to determine one share's value relative to another.
Here are three common investment ratios:
- The price: earnings (p:e) ratio is the most common investment ratio. It tells you how many rand you are paying for each rand of earnings.
- The price: book ratio shows whether the market has factored a company's asset value (on its balance sheet) into its share price.
- The price: sales ratio is the share price divided by sales per share.
One share is cheaper than another when its relevant investment ratio is cheaper than that of the second share.
The dividend yield is the dividend per share divided by the share price. The share with the highest dividend yield is the cheapest, all other things being equal. Shareholders can compare this to how much money they will earn if they put their cash into a money market account, remembering that dividends are tax-free whereas interest (above a threshold) is not.
Market cycles
Markets go through different stages – or cycles – even though the long-term trend has been for share prices to appreciate.
All markets are cyclical: they increase, peak, fall and then bottom. Market cycles are more important for traders than long-term investors who leave their money in the market for longer than a complete cycle.
Typically there are four phases in a market cycle. The first, or accumulation, phase occurs once a stock market has reached the bottom of the last cycle. However, most investors don't recognize this as the beginning of a new upward cycle so only very astute and experienced investors enter the market at this stage. Though valuations are attractive, market sentiment remains bearish (negative) and then, slowly, turns neutral. In the mark-up phase, share prices begin to increase as more investors realise that the cycle has turned. During the distribution phase, sellers begin to dominate. The market's bullish (positive) sentiment becomes mixed and prices can be range-bound. This third phase can be short or long, but it inevitably gives way to the final stage of the cycle. The mark-down phase is the last stage of the investment cycle.
Ironically most die-hard investors, who have held onto their stocks as prices crumble, will sell just as the market reaches its bottom.
There are variations within this simplistic framework as investor sentiment can stretch market cycles to extremes such as bull markets, bubbles, crashes, corrections and bear markets.
- In a bull market, positive investor sentiment drives share prices higher.
- Corrections are where share prices retrace some of their gains.
- A bear market occurs where share prices continue to fall for some time after a correction.
- Over-inflated stock market bubbles may be ended by crashes, where share prices fall sharply in a short period. The good news is that the share prices of the corporate survivors of these crashes do recover.
The golden rules of share investing
The secret to successful investing is discipline, not luck. There are some basic trading rules that everyone – from novice to guru – can use to minimise losses and maximise investment gains.
There are five possible outcomes from buying stocks: a big profit, a big loss, a small profit, a small loss and breakeven. Successful investing means avoiding those big losses.
- Never put money into the market that you can not afford to lose.
- Use stop-losses to help prevent losses in trading. Do your own homework before you commit your money to an investment.
- Set realistic expectations.